This function creates minimalistic ggplot2 theme for scientific plots in ggplot2. It removes gridlines, simplifies axis formatting, and adds clean, bold titles and labels.
Examples
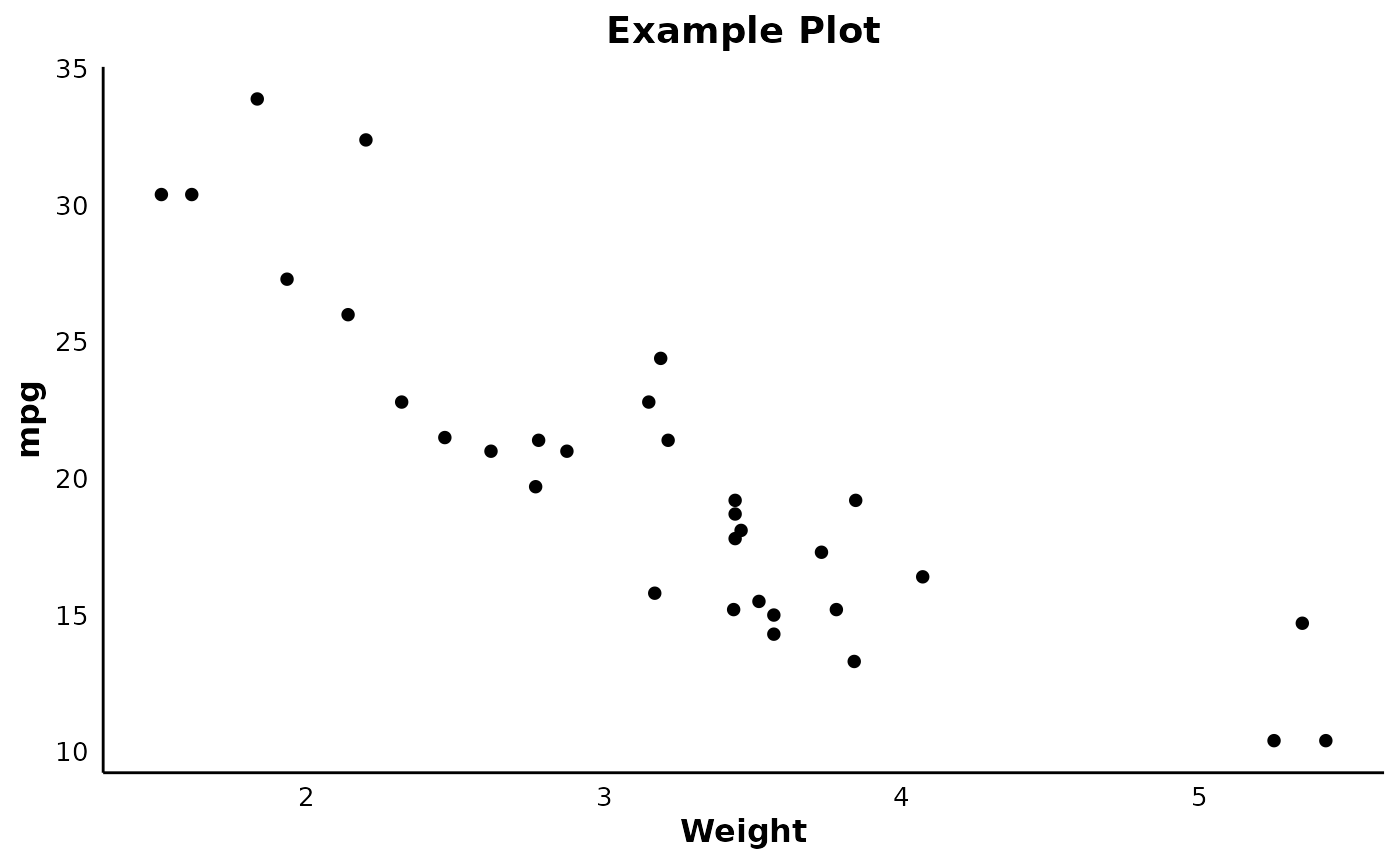
# Example usage:
library(ggplot2)
p <- ggplot(mtcars, aes(x = wt, y = mpg)) +
    geom_point() +
    labs(title = "Example Plot", x = "Weight", y = "mpg") +
    theme_science()
print(p)