3 Results
3.1 AUC Scores
AUC scores comparing model fit from the soil models to each alternative soil land cover layer showed marginal, if any, improvements depending on the taxa. On the other hand, model performance for some species declined substantially compared to soil-based model (e.g., vascular plants, cf. terrain wetness). On average, the number of models which improved were highest for using the terrain wetness layer, and lowest using the land facet model layer.
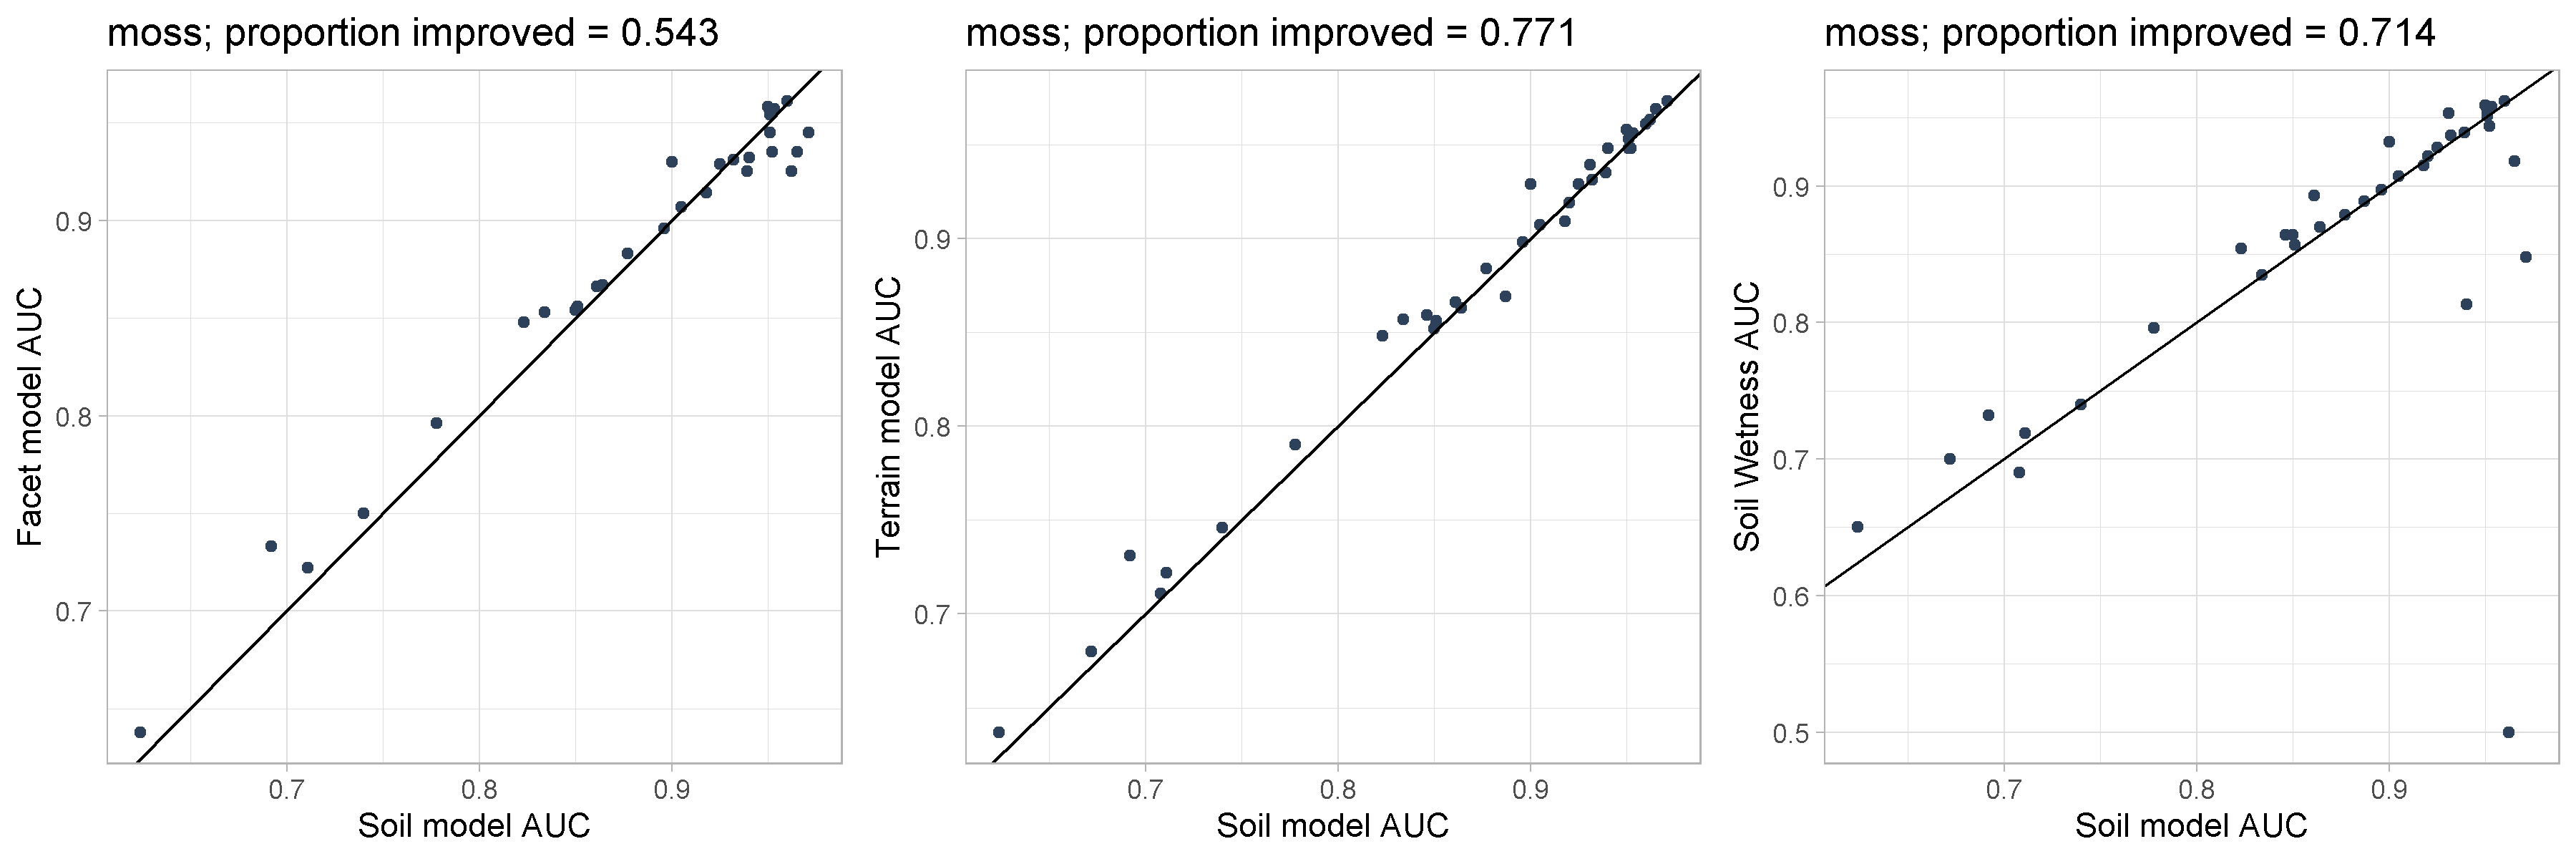
Correlation plots of AUC scores between the soil models and each alternative landcover for bryophytes.
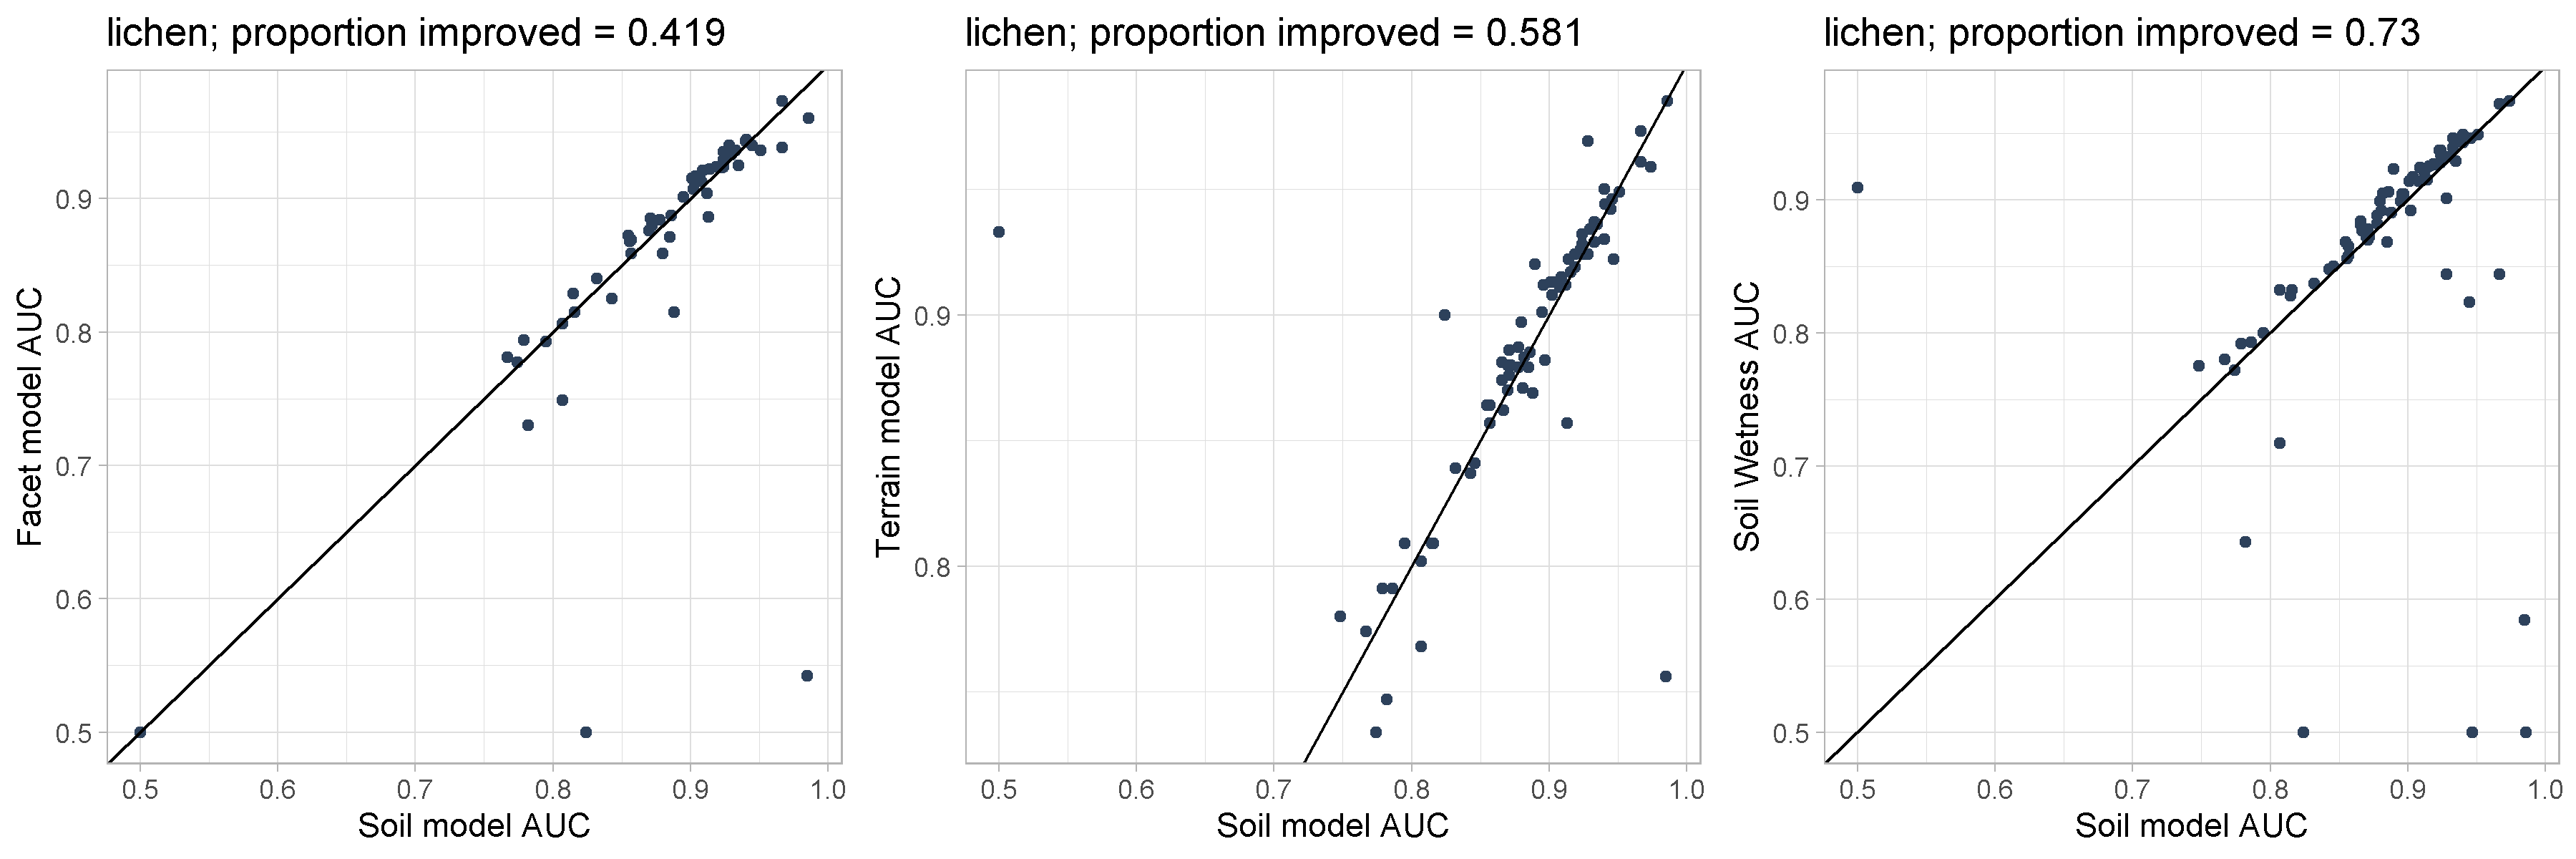
Correlation plots of AUC scores between the soil models and each alternative landcover for lichens.
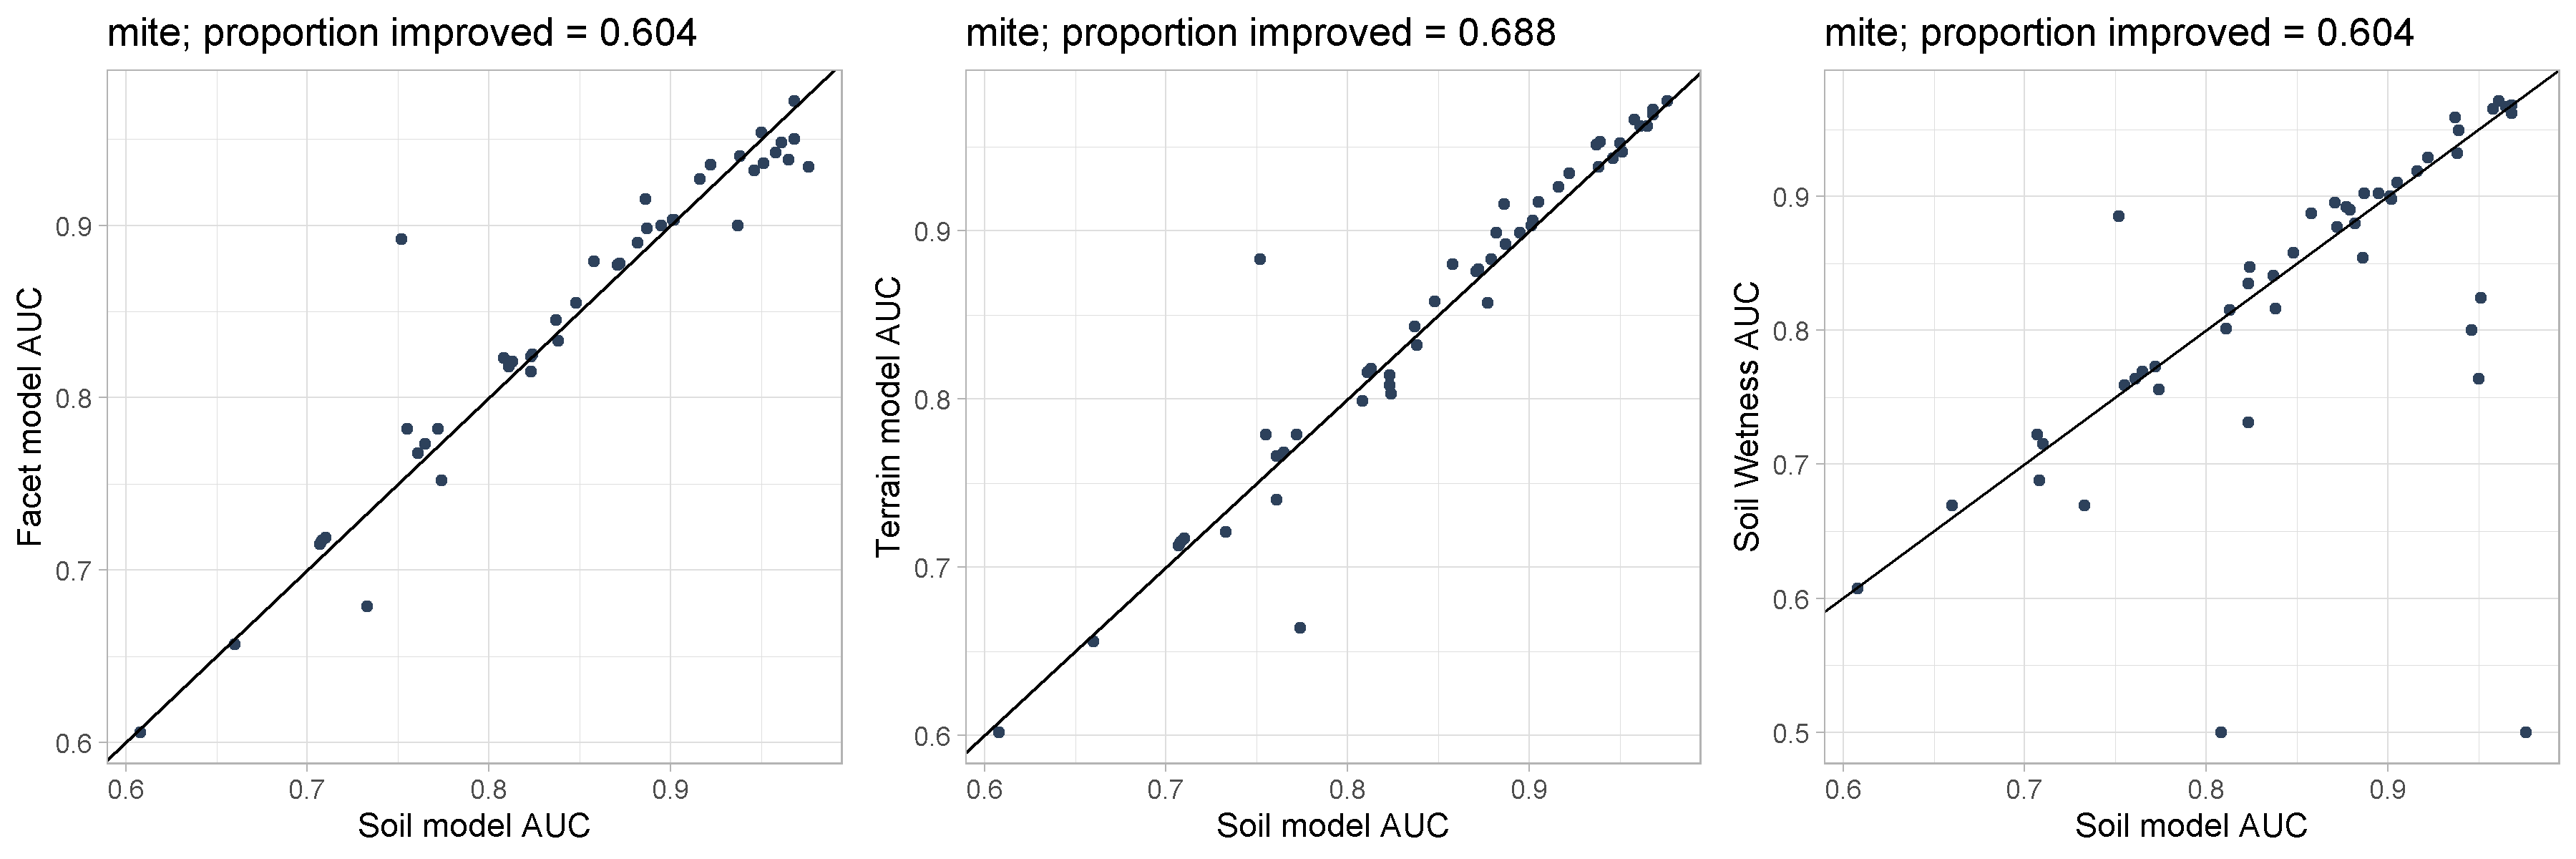
Correlation plots of AUC scores between the soil models and each alternative landcover for soil mites.
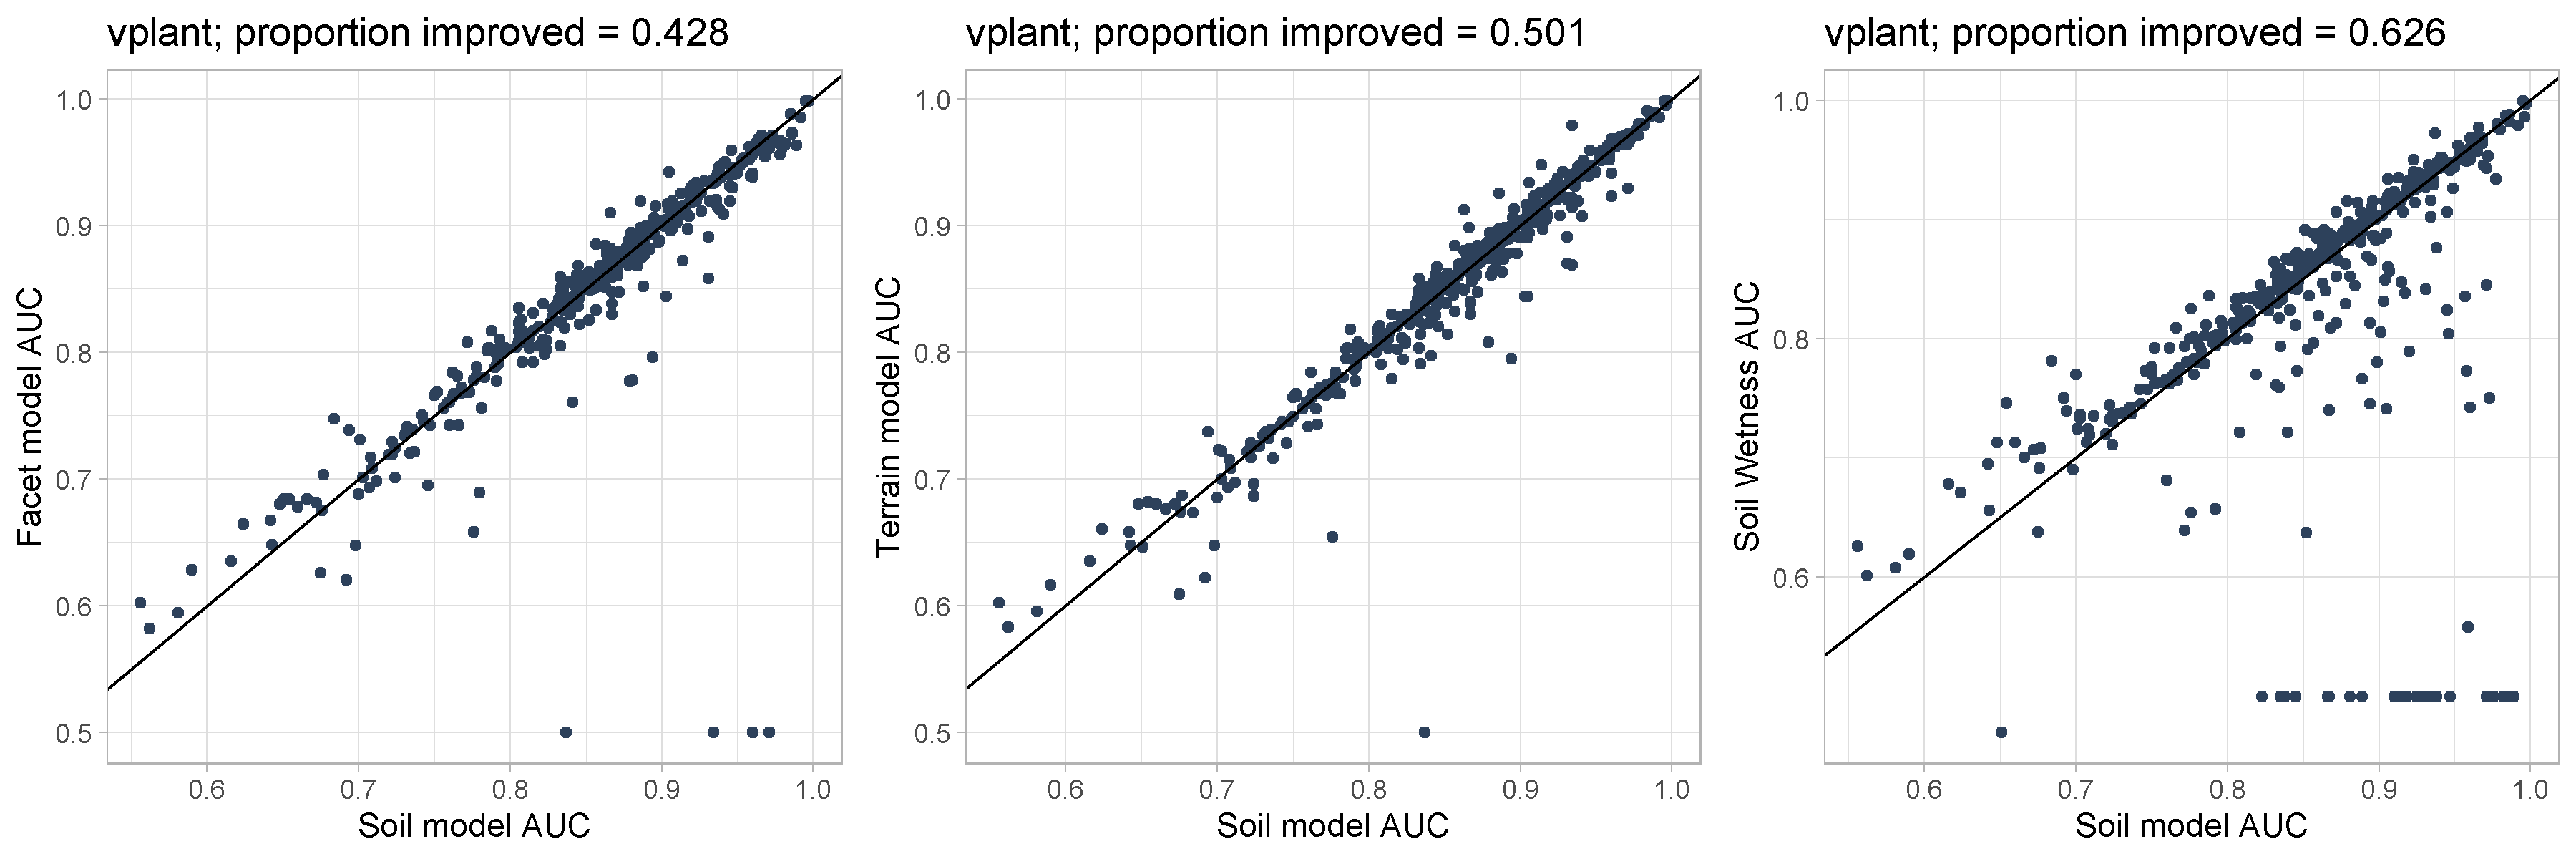
Correlation plots of AUC scores between the soil models and each alternative landcover for vascular plants.
3.2 Predictions
Predictions between the soil layer and the three alternative layers were often highly correlated. We did observe vertical bands in the correlation plots suggesting some ABMI sites with a consistent soil classification (e.g., 100% clay) were classified as multiple land cover types using the alternative layers.
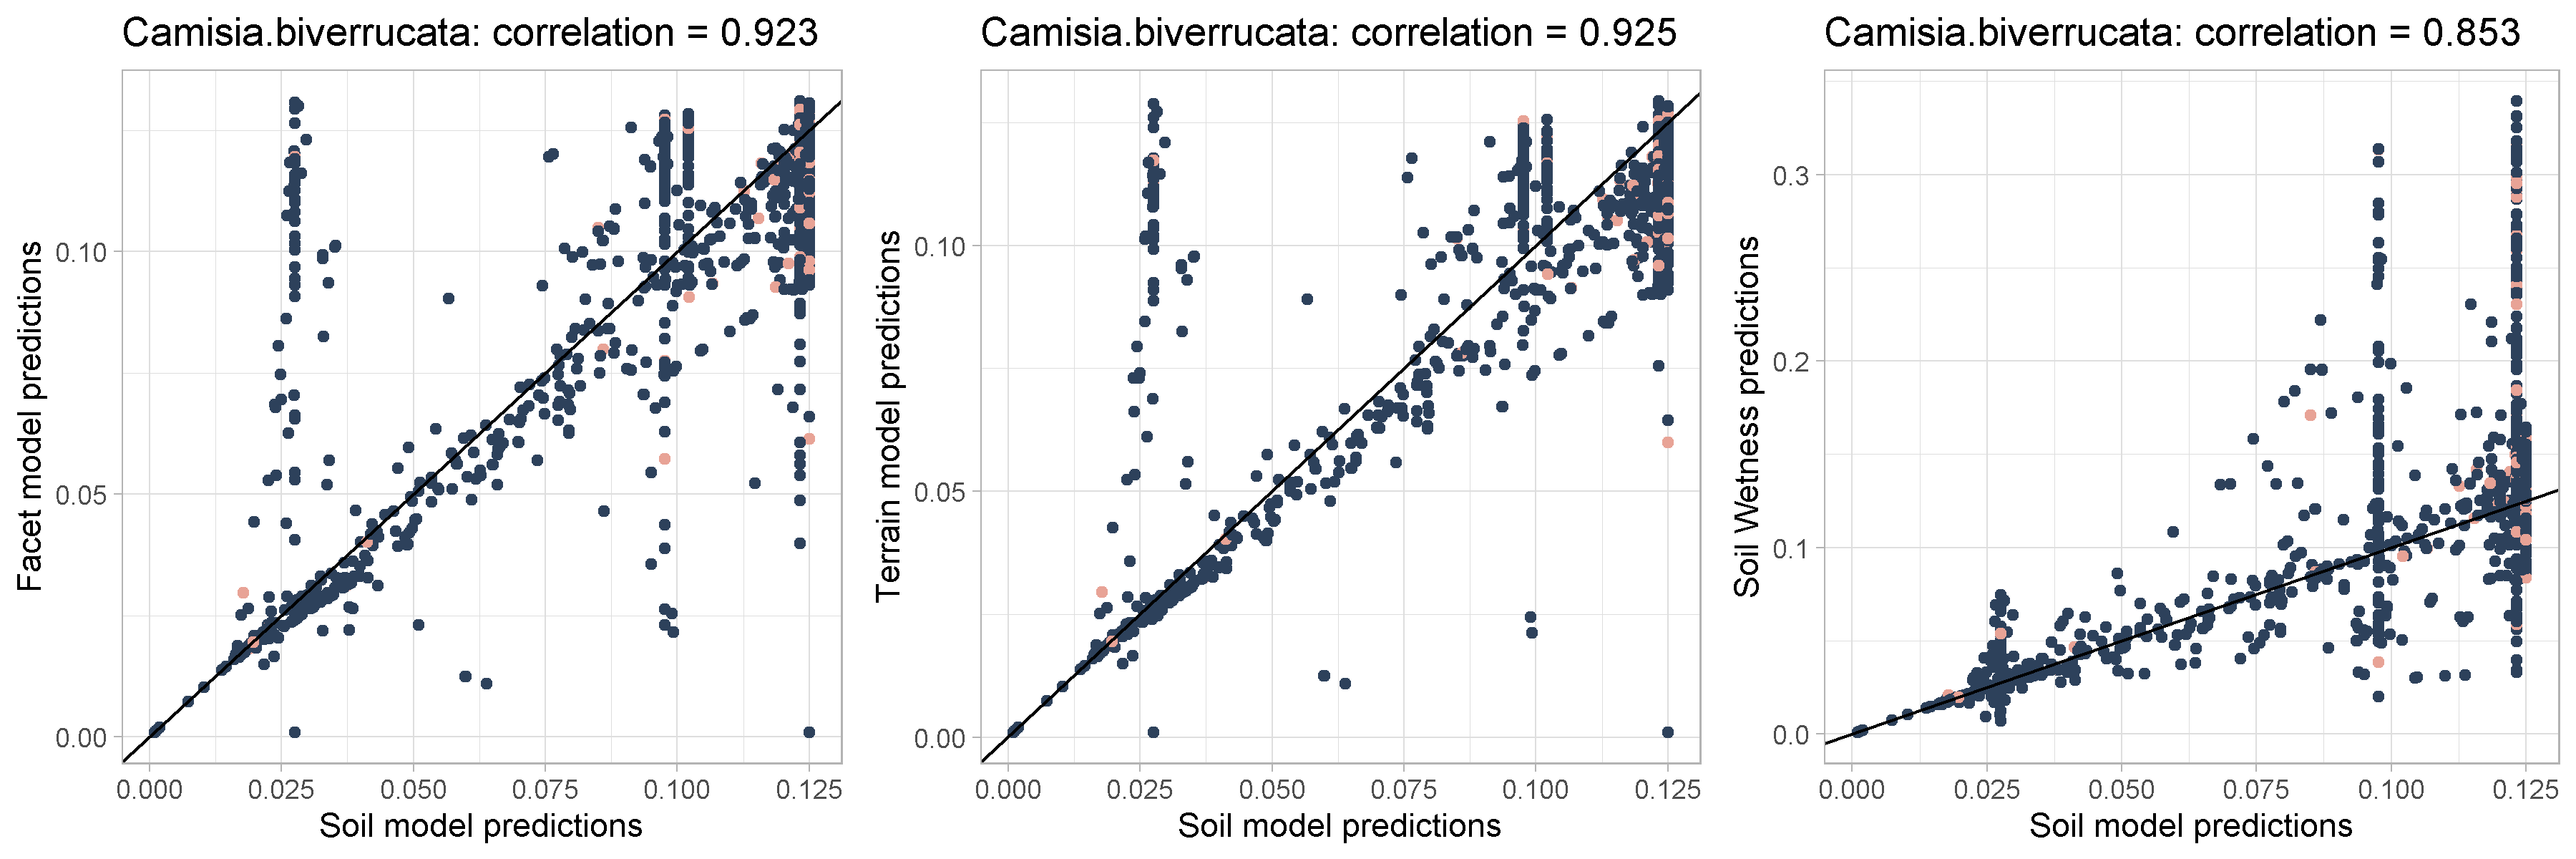
Correlation plots of site level predictions between the soil models and each alternative landcover for Camisia biverrucata. Blue represents absences and pink represents occurrences.
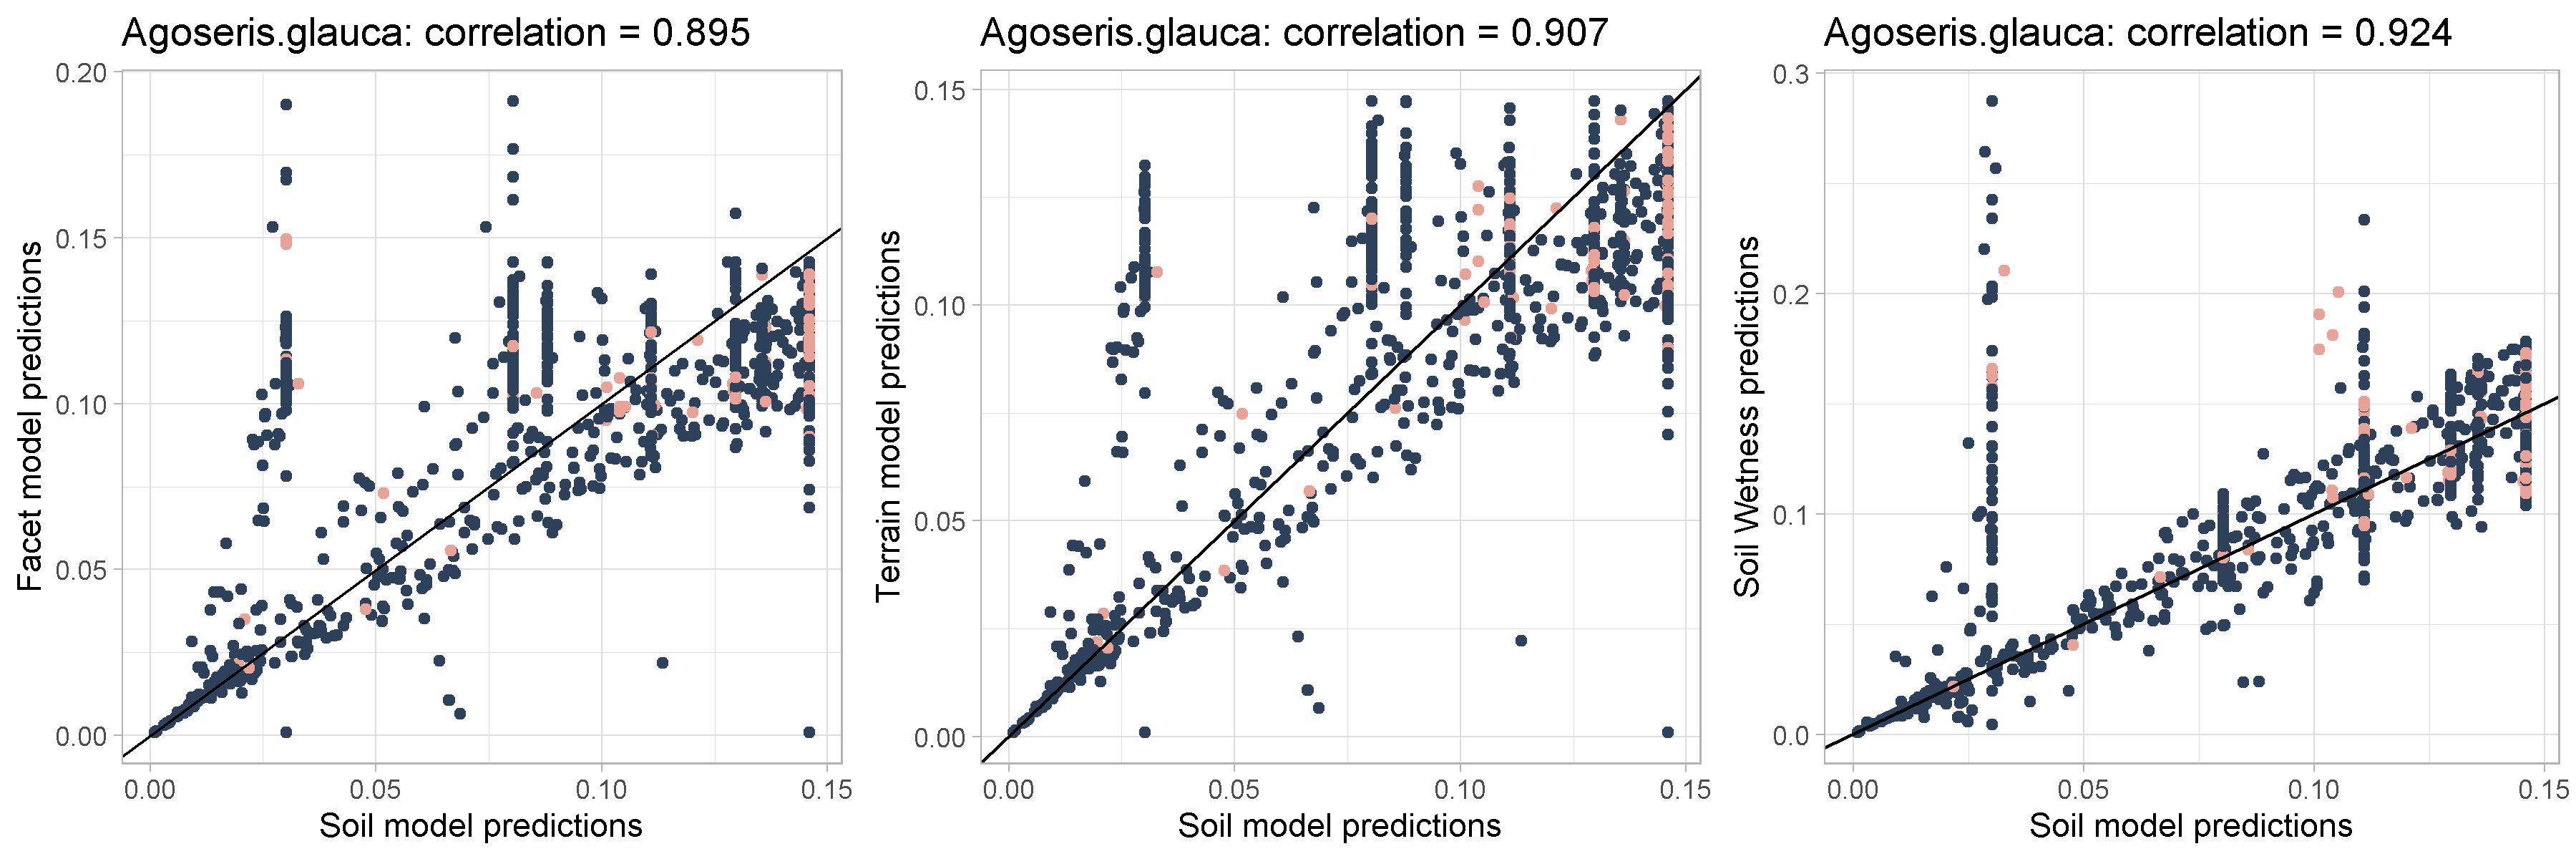
Correlation plots of site level predictions between the soil models and each alternative landcover for Agoseris glauca. Blue represents absences and pink represents occurrences.
We visually assessed the discrimination power of the models vis-à-vis detection and found that the apparent difference in predicted probabilities between land cover layers largely did not reflect difference in detections.
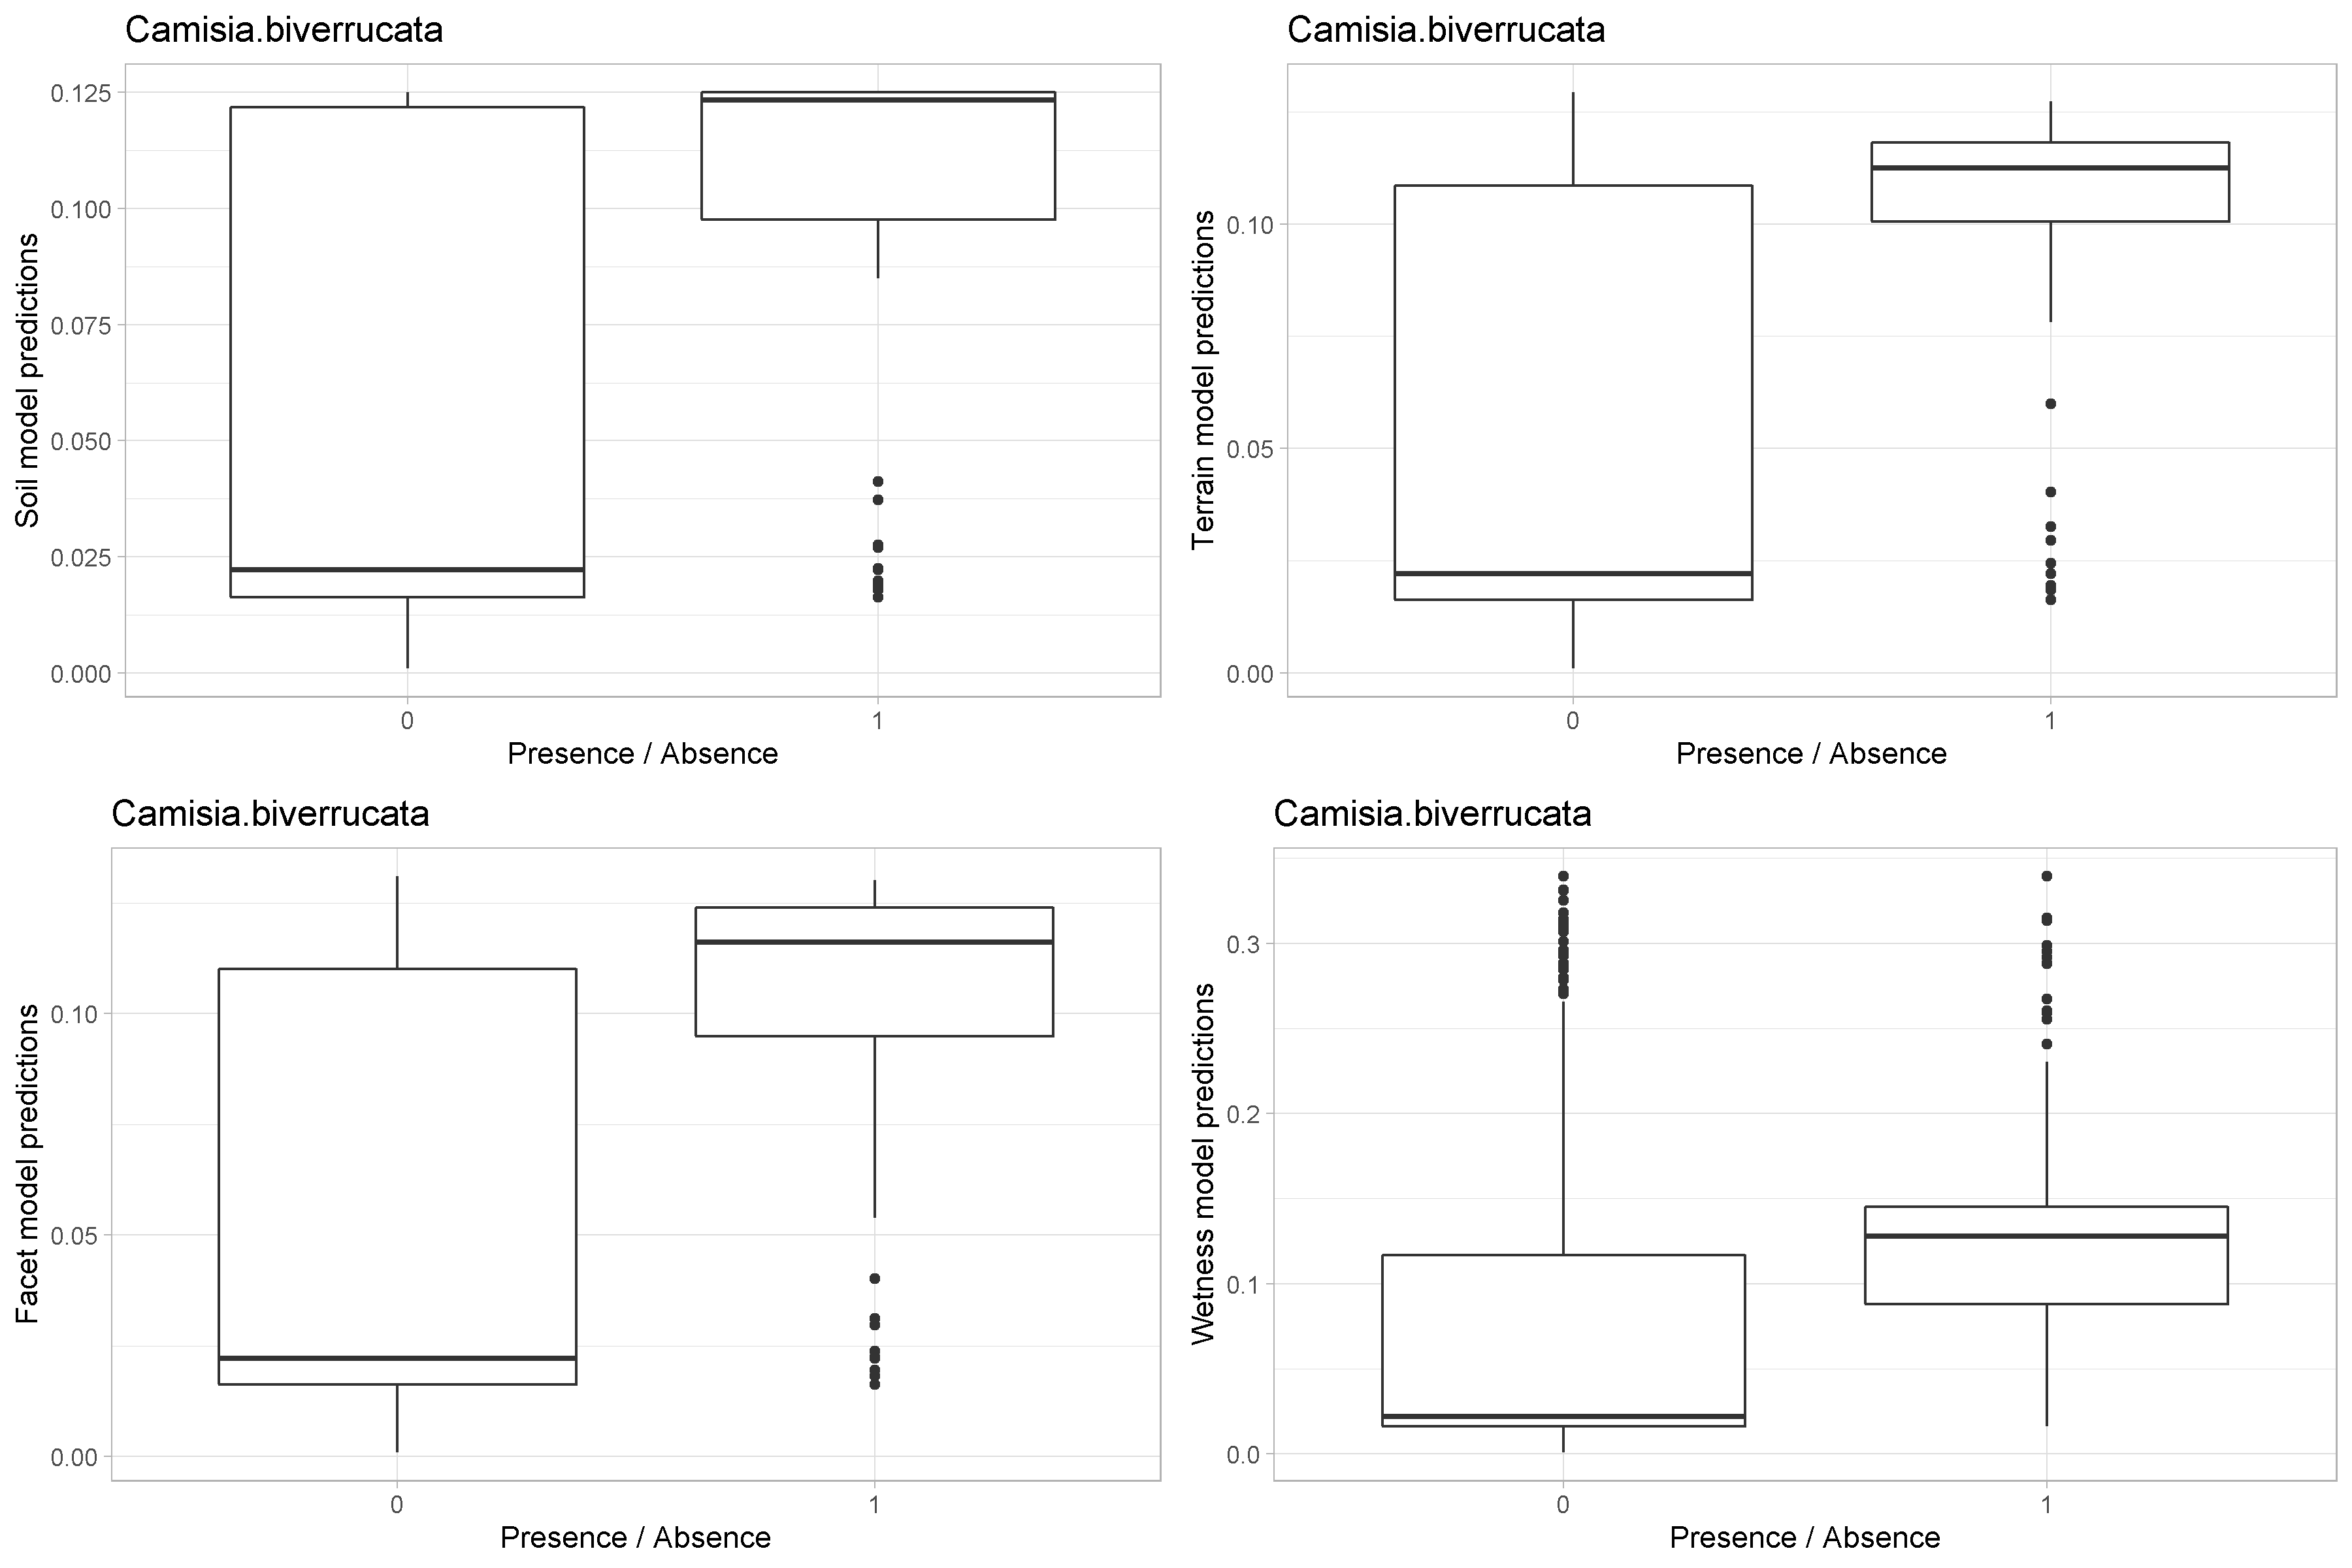
Boxplot plots of site level predictions of presence/absences between the soil models and each alternative landcover for Camisia biverrucata.
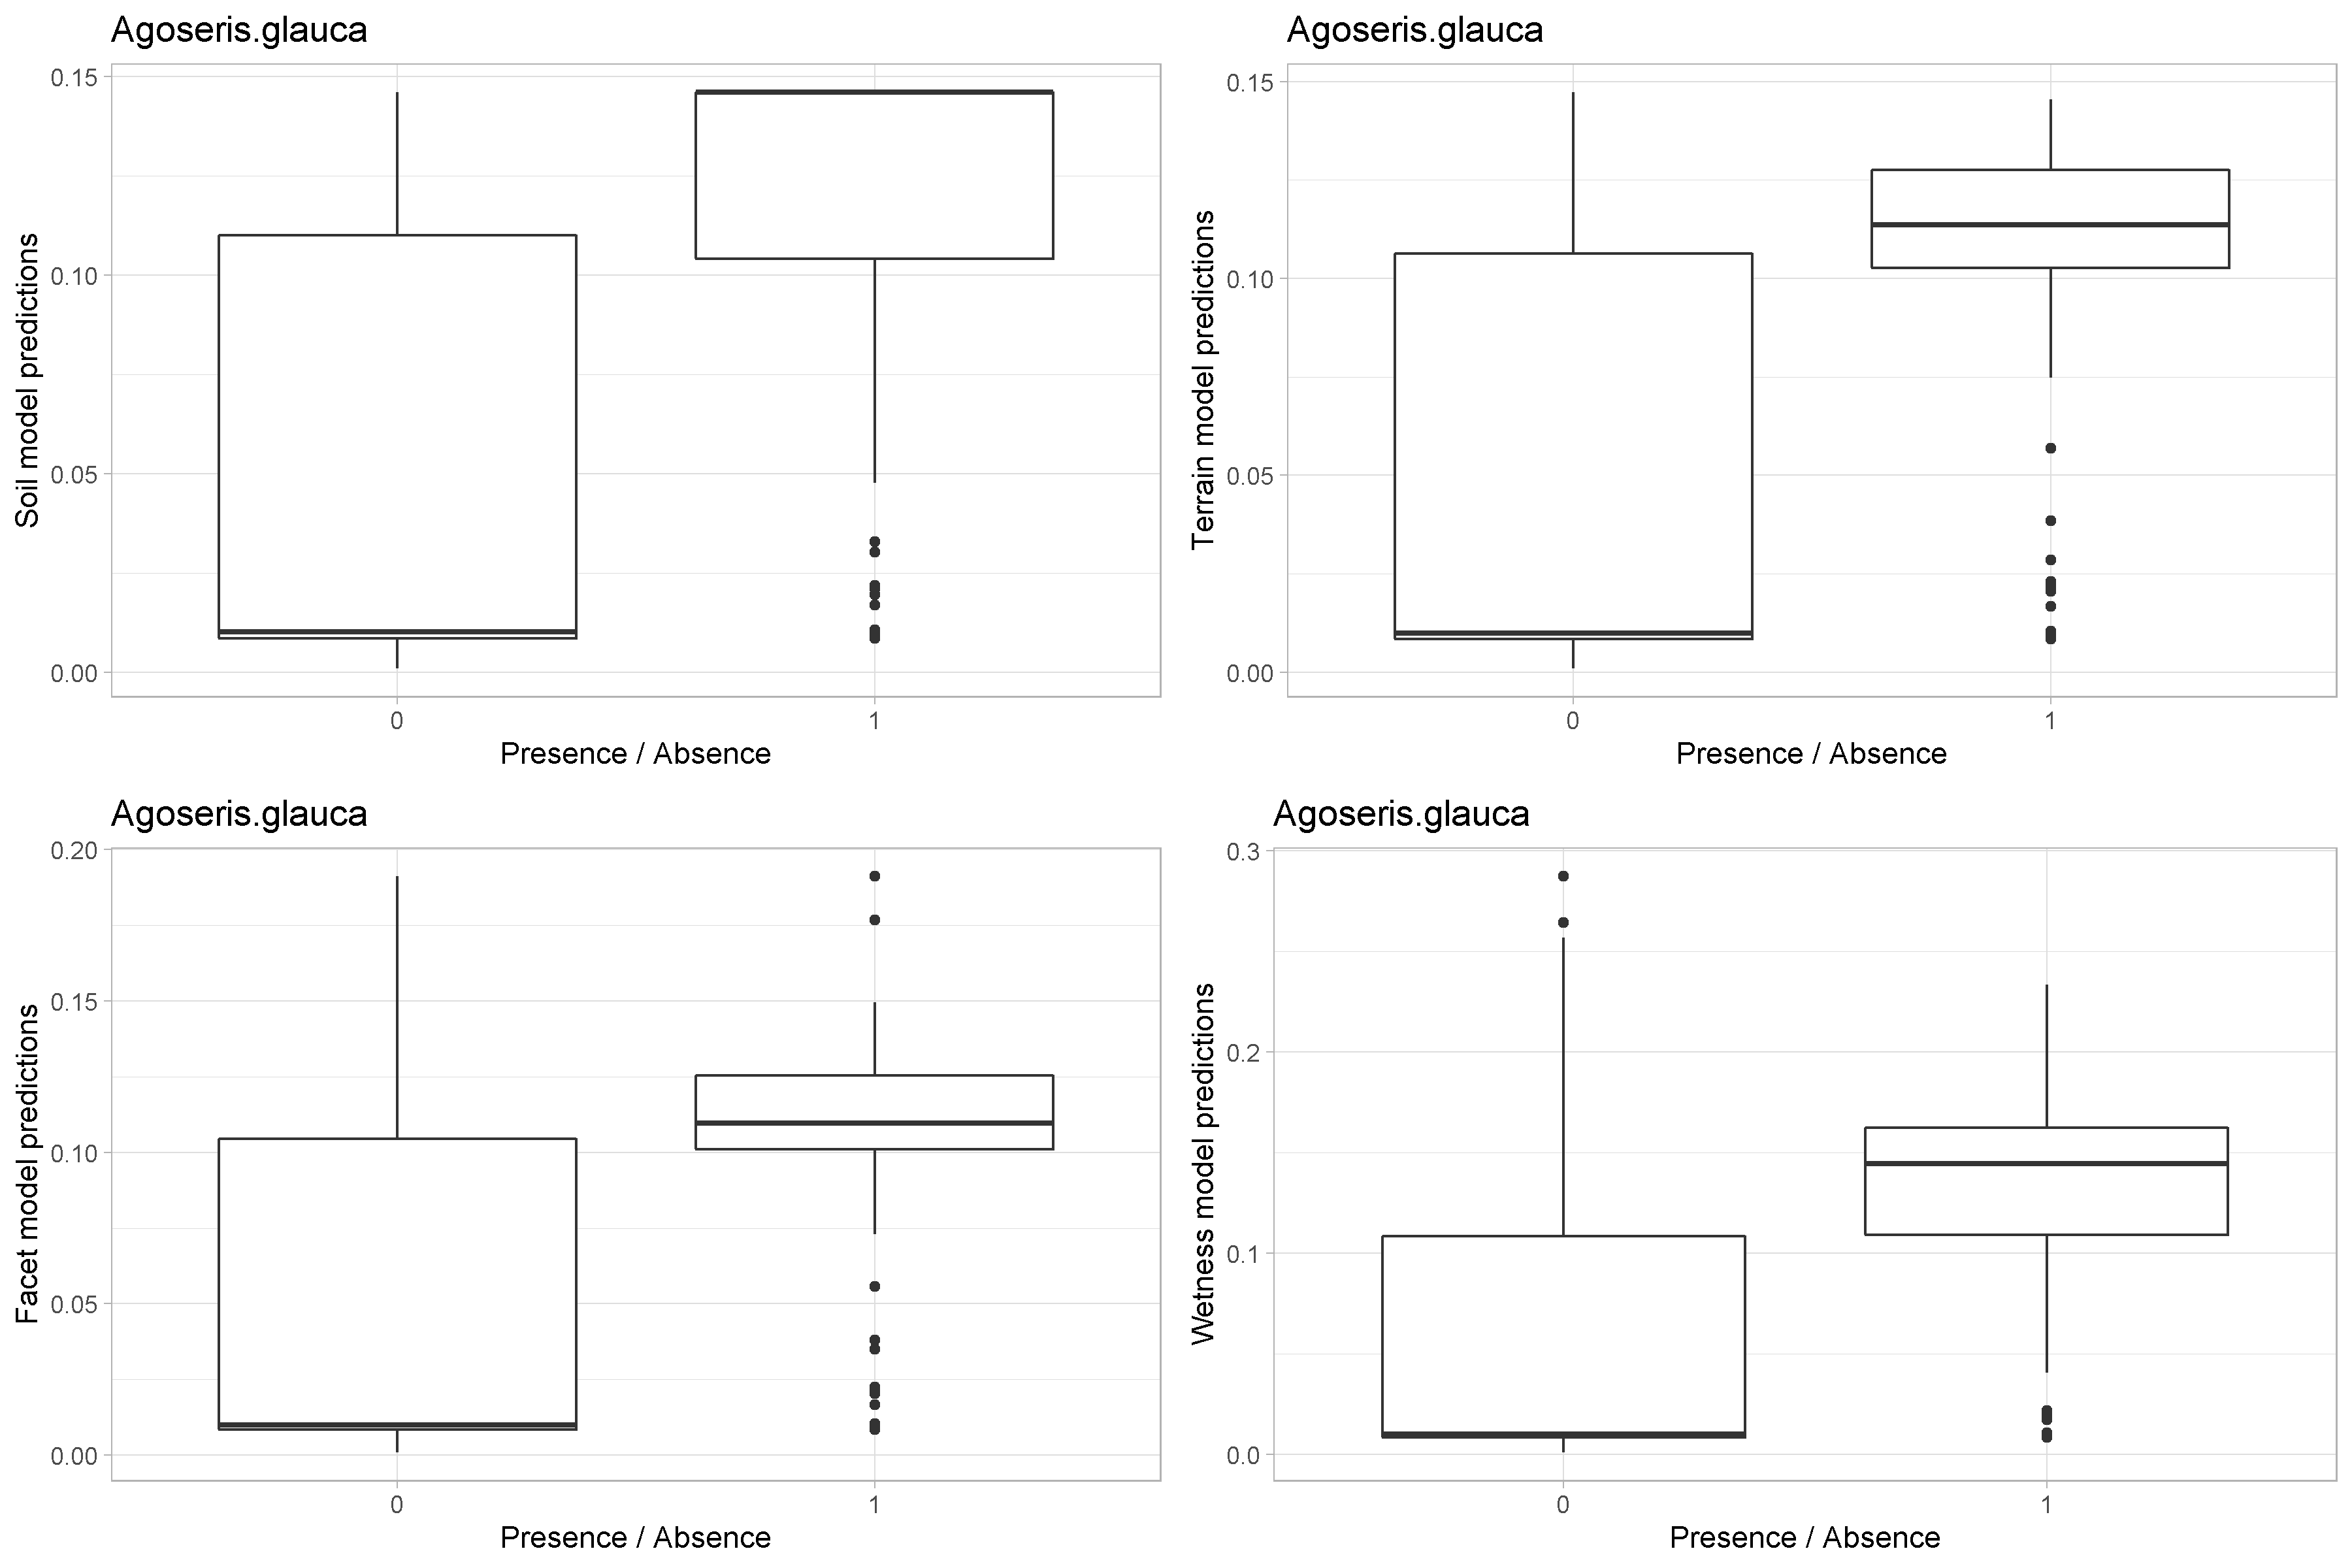
Boxplot plots of site level predictions of presence/absences between the soil models and each alternative landcover for Agoseris glauca.
3.3 Cluster analysis
Cluster analyses of both the use-availability and model-based coefficients show reasonable clustering of coefficients. However, there are coefficients which are not clustered appropriately. For example, the Other_Wet category clustered with human footprint features in the terrain wetness model. These errors are often resolved when looking at the use-availability, so this could indicate that our simple modeling approach has issues with properly estimating certain coefficient types.
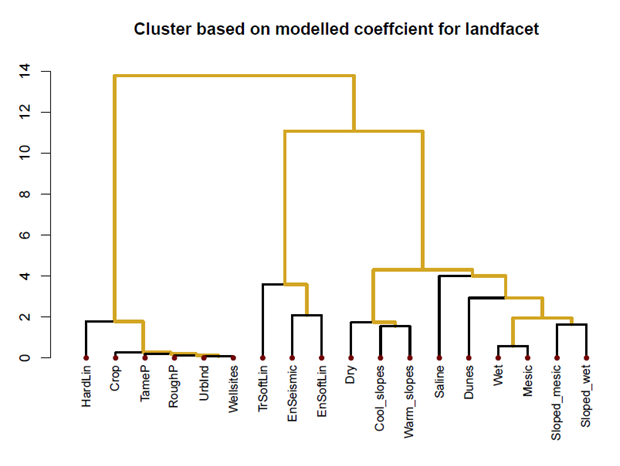
Cluster analysis of the modelled coefficients using the land facet landcover layer.
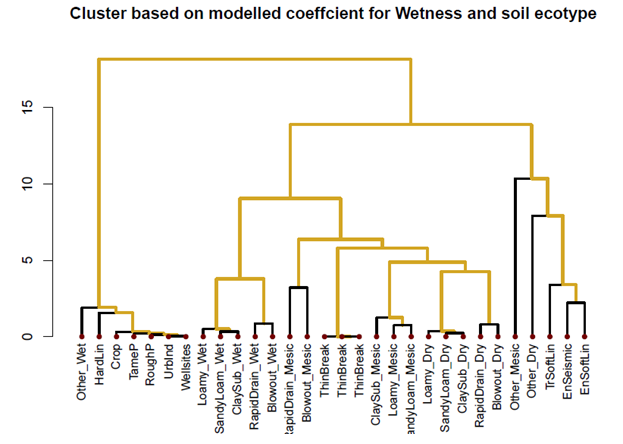
Cluster analysis of the modelled coefficients using the soil moisture landcover layer.
3.4 Supplementary
Species coefficient, prediction-based correlation, and prediction discrimination figures for each species are available on the internal ABMI Science Centre drive. In addition, use-availability for the land facet (Appendix 1) and soil moisture layers (Appendix 2) and modeled coefficients (Appendix 3,4) for vascular plants are also available to ABMI staff.