4 Interpreting Regional Connectivity
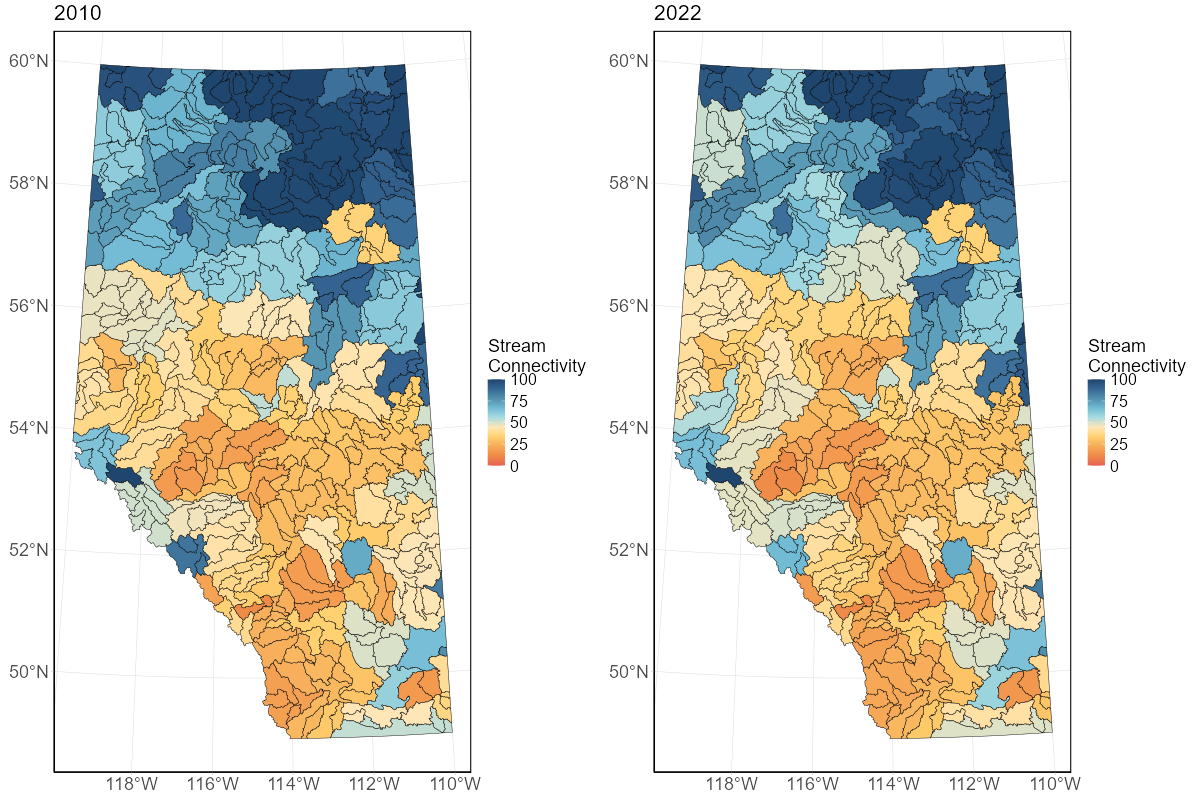
To represent stream connectivity at a regional scale, we calculated the length weighted stream connectivity using all stream segments within each HUC-6 unit (\(C_{j}\)). This means regional connectivity values can be calculated for multiple scales (e.g., watershed unit, natural subregion, etc) as long as stream segments are properly clipped and lengths recalculated.
Connectivity scores are available for multiple years (2010, 2014, 2016, 2018, 2019, 2020, 2021, and 2022) and can be used to understand how connectivity has changed over time.
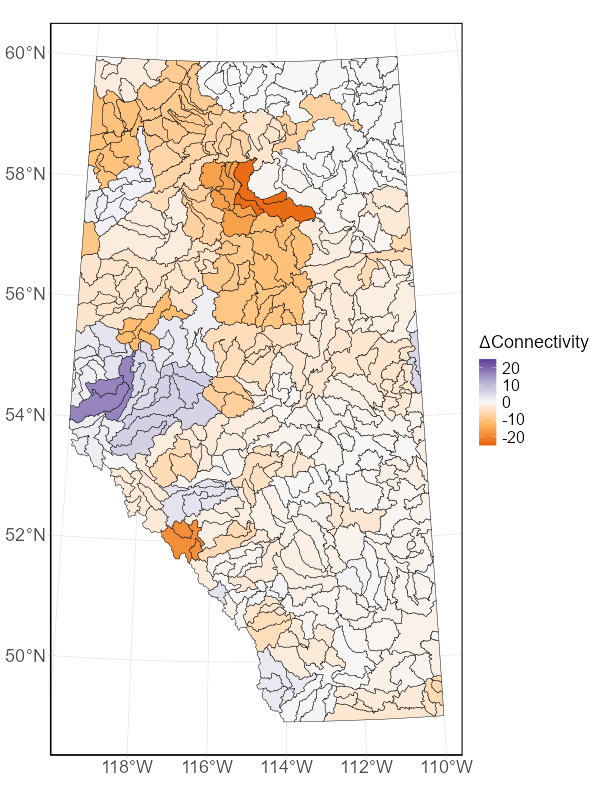
Since 2010, we have observed improved connectivity (greater than 1%) in 52 HUC-8 watersheds, with an average gain of 4.5%. However, the majority of watersheds experienced either no change (143) or declines (227) in stream connectivity. On average, these watersheds declined 5.37%, with 83 watersheds experiencing declines greater than 5% over the 12-year period.